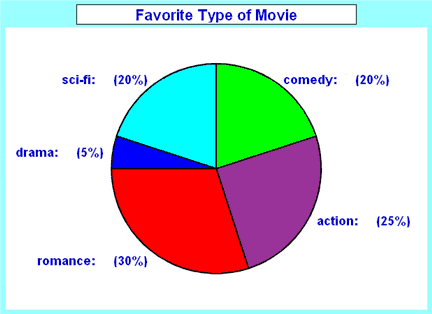

Here's a survey of some friends asking about movie preferences.
| Favourite Type of Movie | ||||
| Comedy | Action | Romance | Drama | SciFi |
|---|---|---|---|---|
| 4 | 5 | 6 | 1 | 4 |

It is a good way to show relative sizes: it is easy to see which movie types are most liked at a glance.
You can Create Graphs with our Graph Maker or you can make them yourself .
Your practice Pie Chart Worksheet
Your practice Pie Chart Quiz (bottom of page)
 First, put the data into a table and add up all the values to get a total:
Next, divide each value by the total to calculate "What Portion of the Whole it is".
Now you need to figure out how many Degrees for each Sector / ("Pie Slice").
A Full Circle has 360 degrees, so we do this calculation:
| Comedy | Action | Romance | Drama | SciFi | TOTAL |
|---|---|---|---|---|---|
| 4 | 5 | 6 | 1 | 4 | 20 |
| 4/20 = .2 | 5/20 = .25 | 6/20 = .3 | 1/20 = .05 | 4/20 = .2 | 1 (one whole) = 100% |
| 0.2 × 360° = 72° |
0.25 × 360° = 90° |
0.3 × 360° = 108° |
0.05 × 360° = 18° |
0.2 × 360° = 72° |
360° |
|
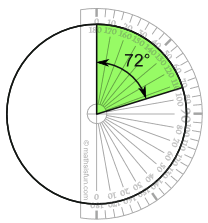
Now you are ready to start drawing! Draw a circle. Then use your protractor to measure the degrees of each sector. Here I show the first sector ... ... you can do the rest! |
 |
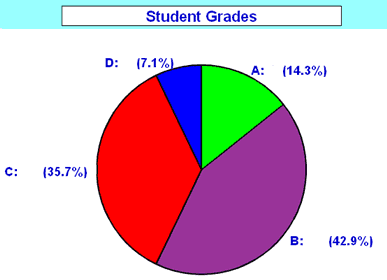
Example: Student Grades
Here is how many students got each grade in the recent test:
| A | B | C | D |
| 4 | 12 | 10 | 2 |
And here is the pie chart:
