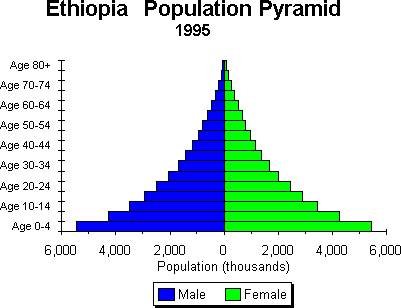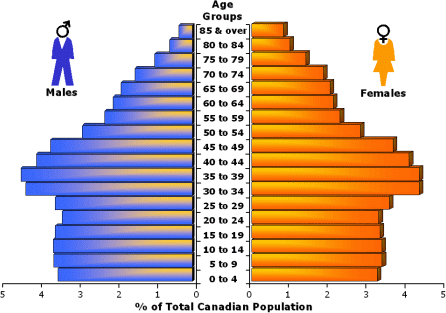


Populations pyramids help demographers understand a country's population structure. This allows government & private companies to plan for the future. ie. Building schools or retirement homes for the elderly.


A scatterplot tries to show the relationship between 2 variables (or statistics). Sometimes there is a correlation (a weak Cause & Effect Relationship). Scatterplots will show this. ie. The more Hours you Study for a test, the higher your Score will be. This is not always the case, but more studying generally causes higher test scores. (The two are correlated.) Or as X increases so does Y.
